Jakarta, Indonesia
Category:
Visual Design, Editorial Design
2024
Project Year
A sustainable effort by one of Indonesia's historic brands.
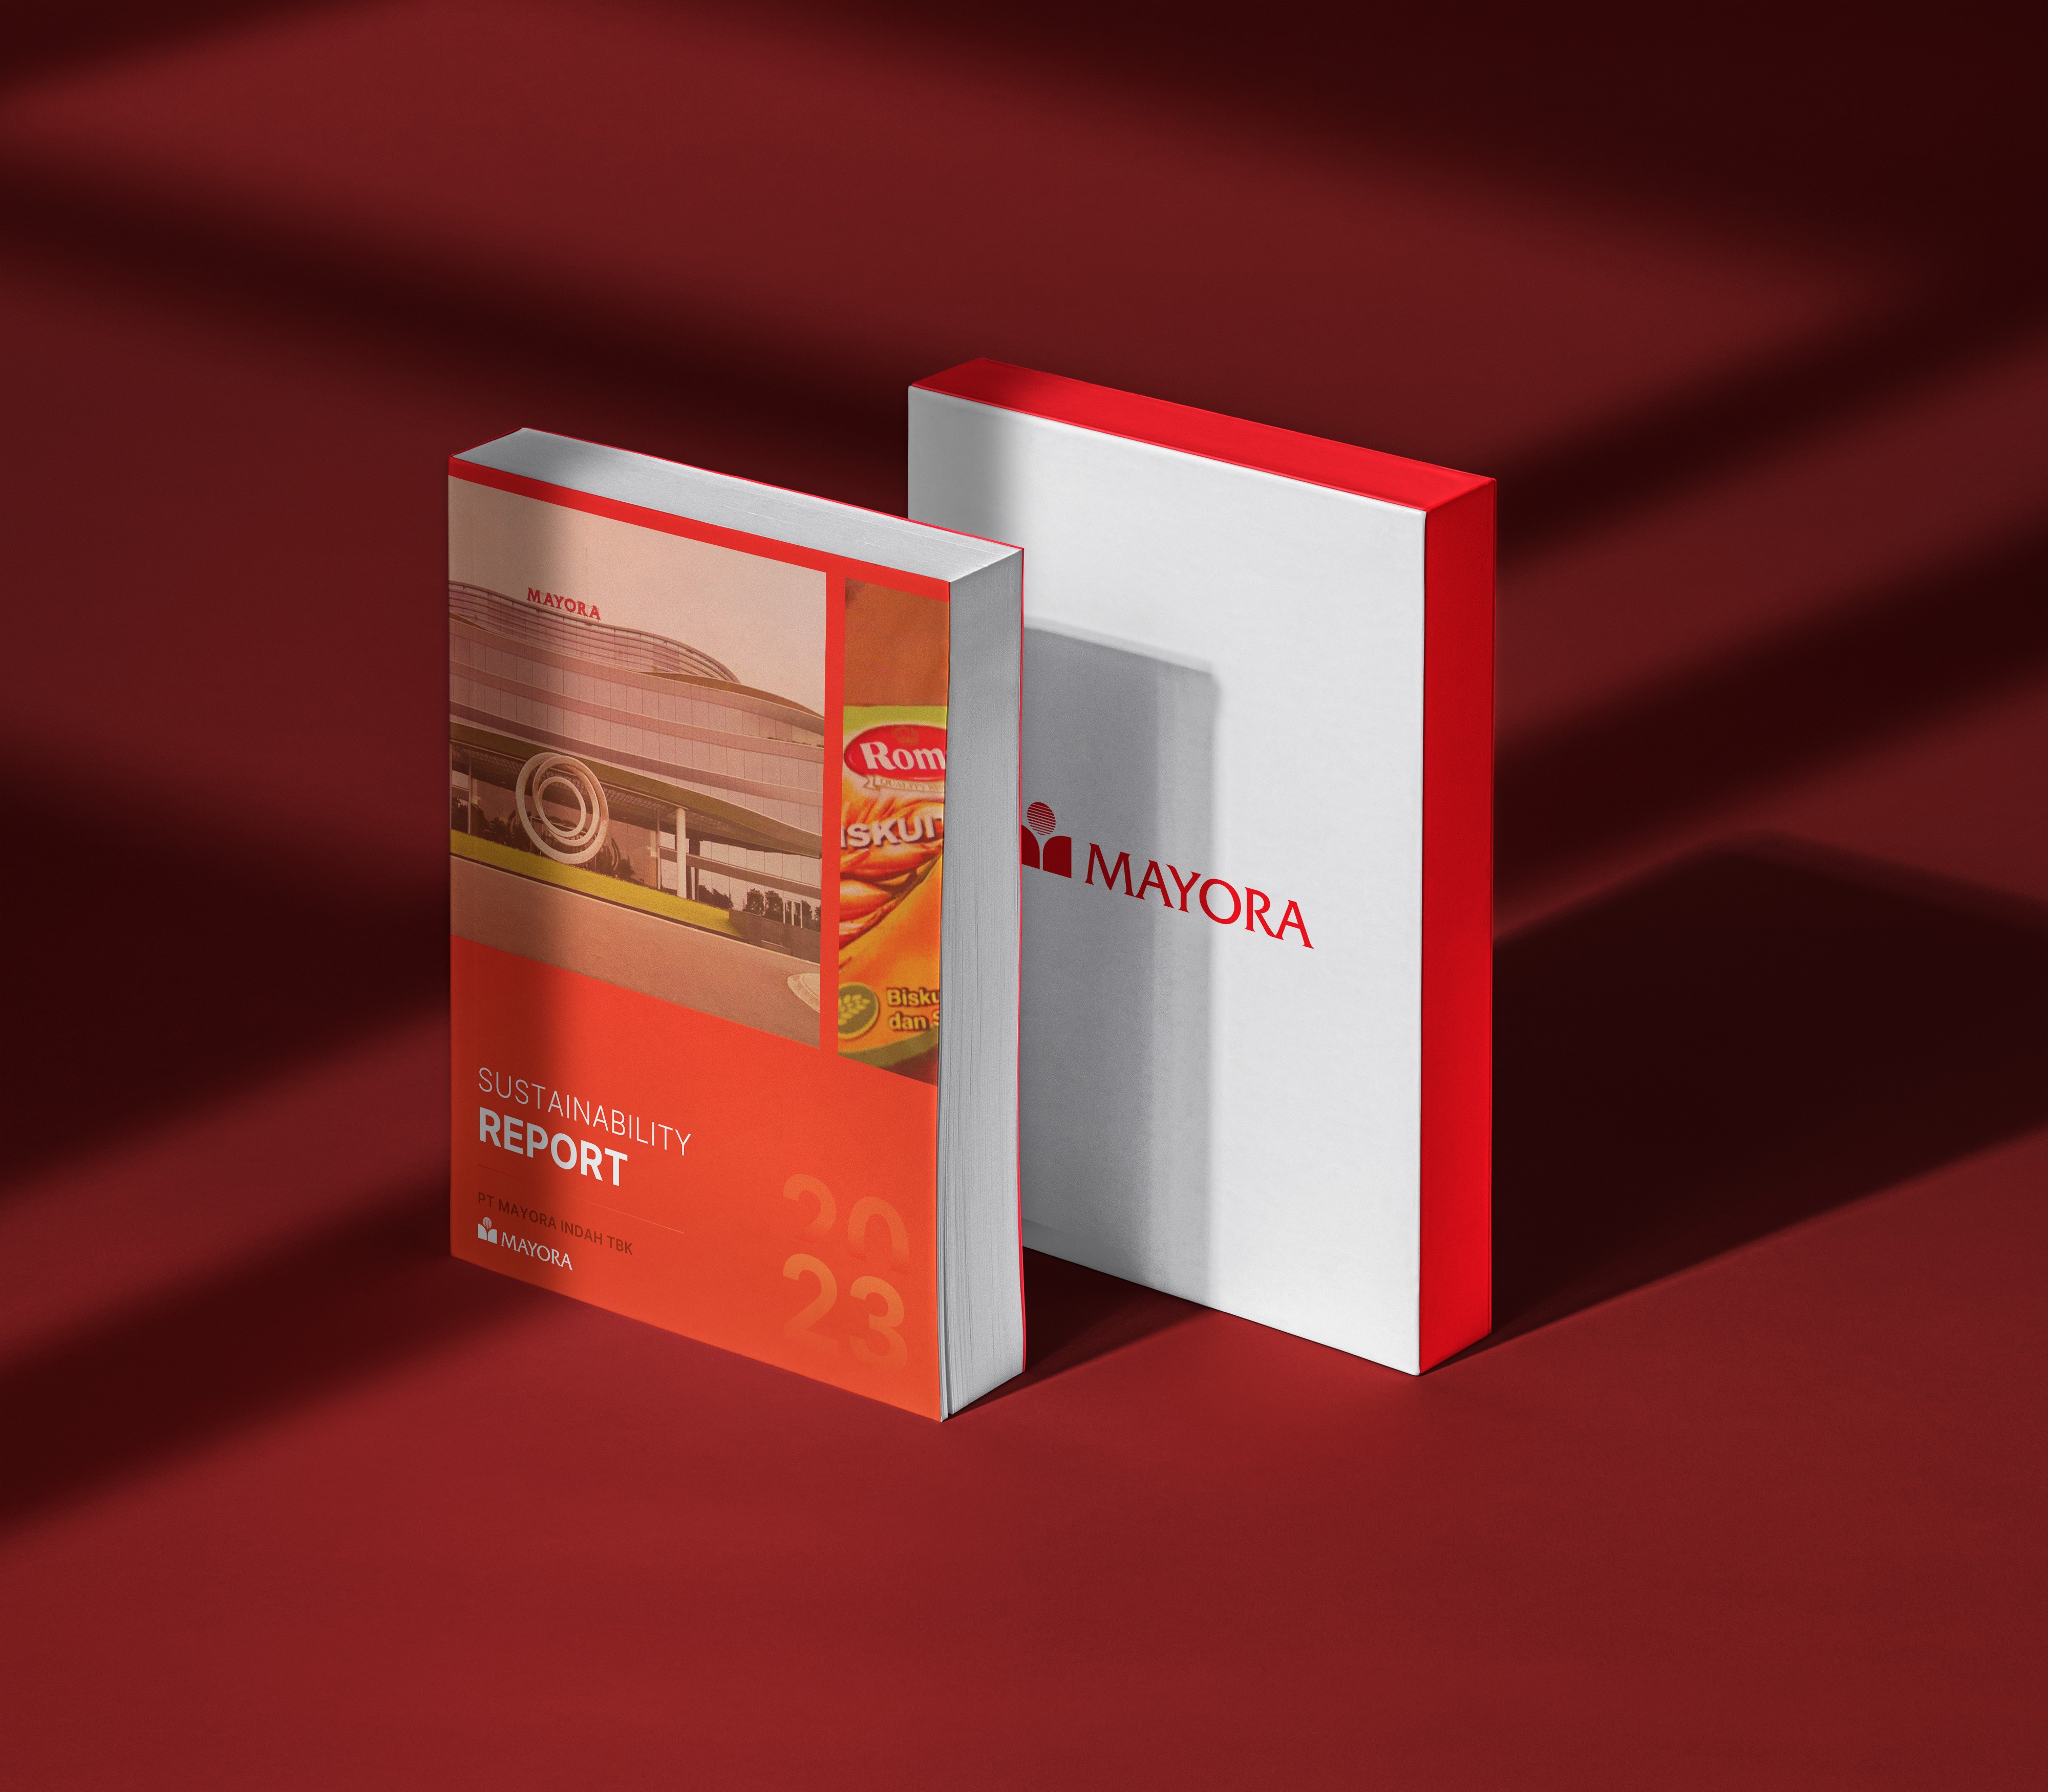

Project Brief
The Design Process
Outlining the Report
I kicked things off by sitting down with Mayora’s sustainability PICs.
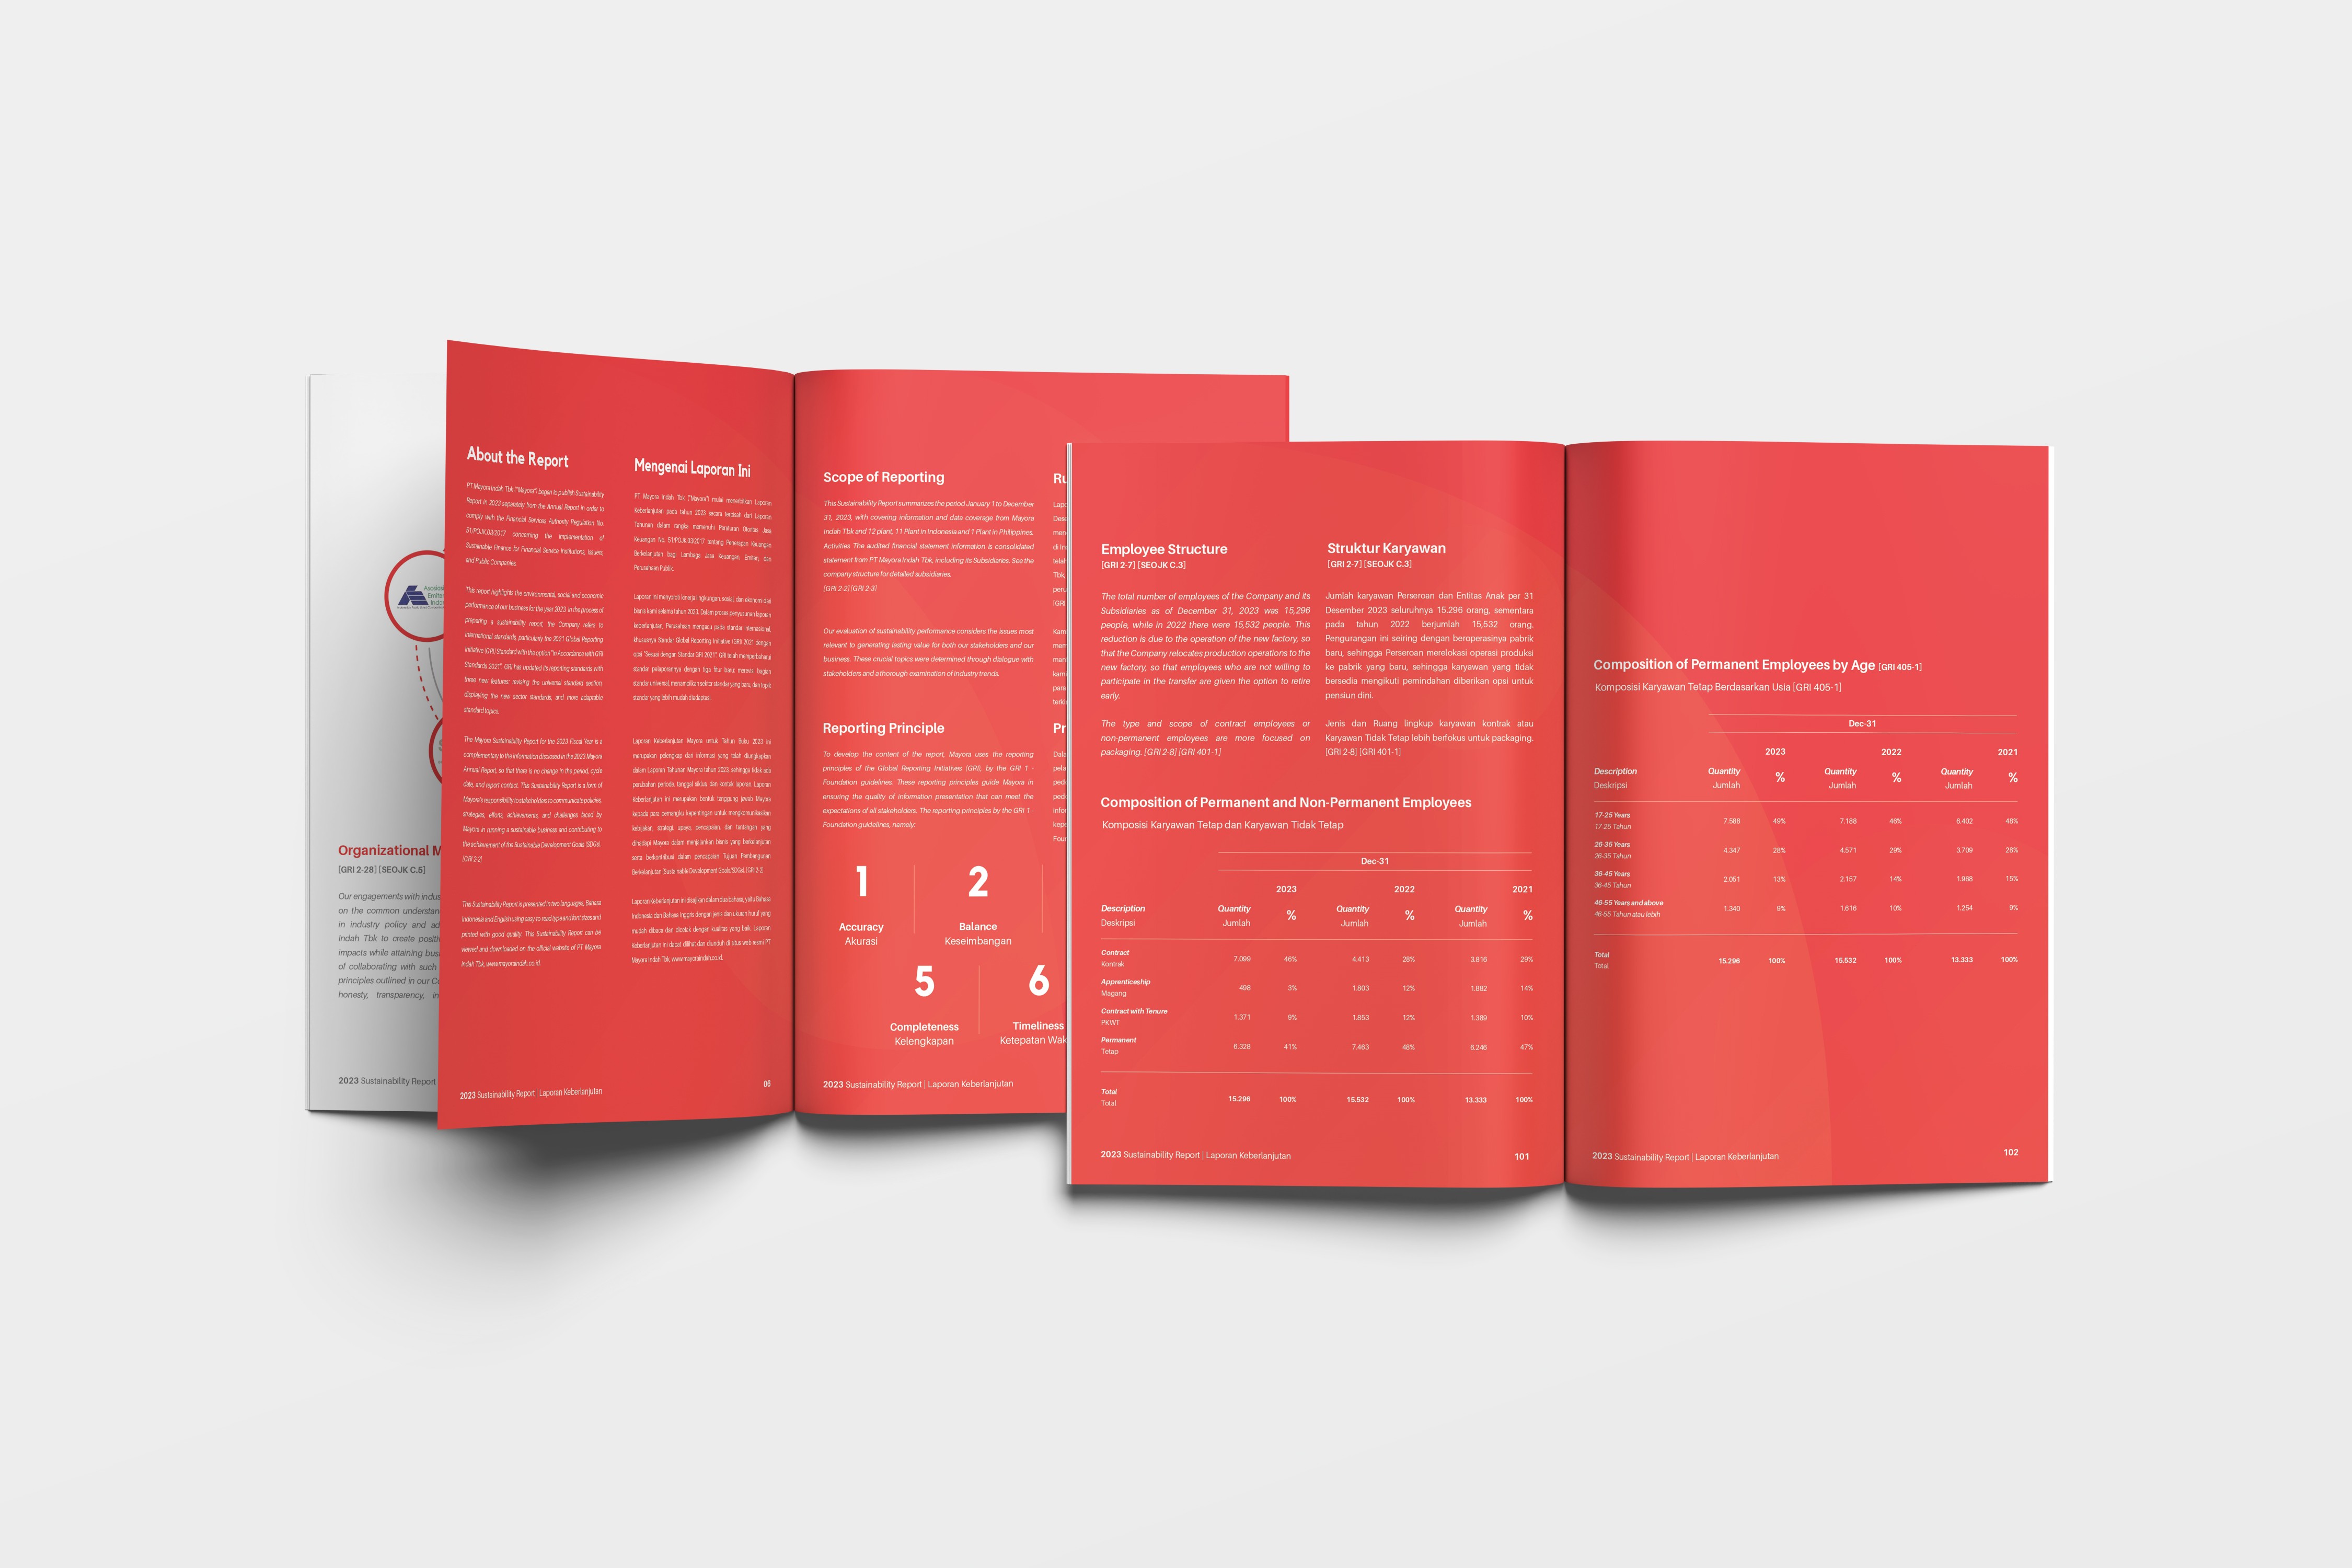
Think back‑to‑back sessions poring over Excel sheets full of water‑use stats and emissions figures. We mapped out key targets (like that 6.96 % drop in water withdrawal and the jump in renewable‑energy usage), and processed them into outlines for each chapter that serve as my working bible.
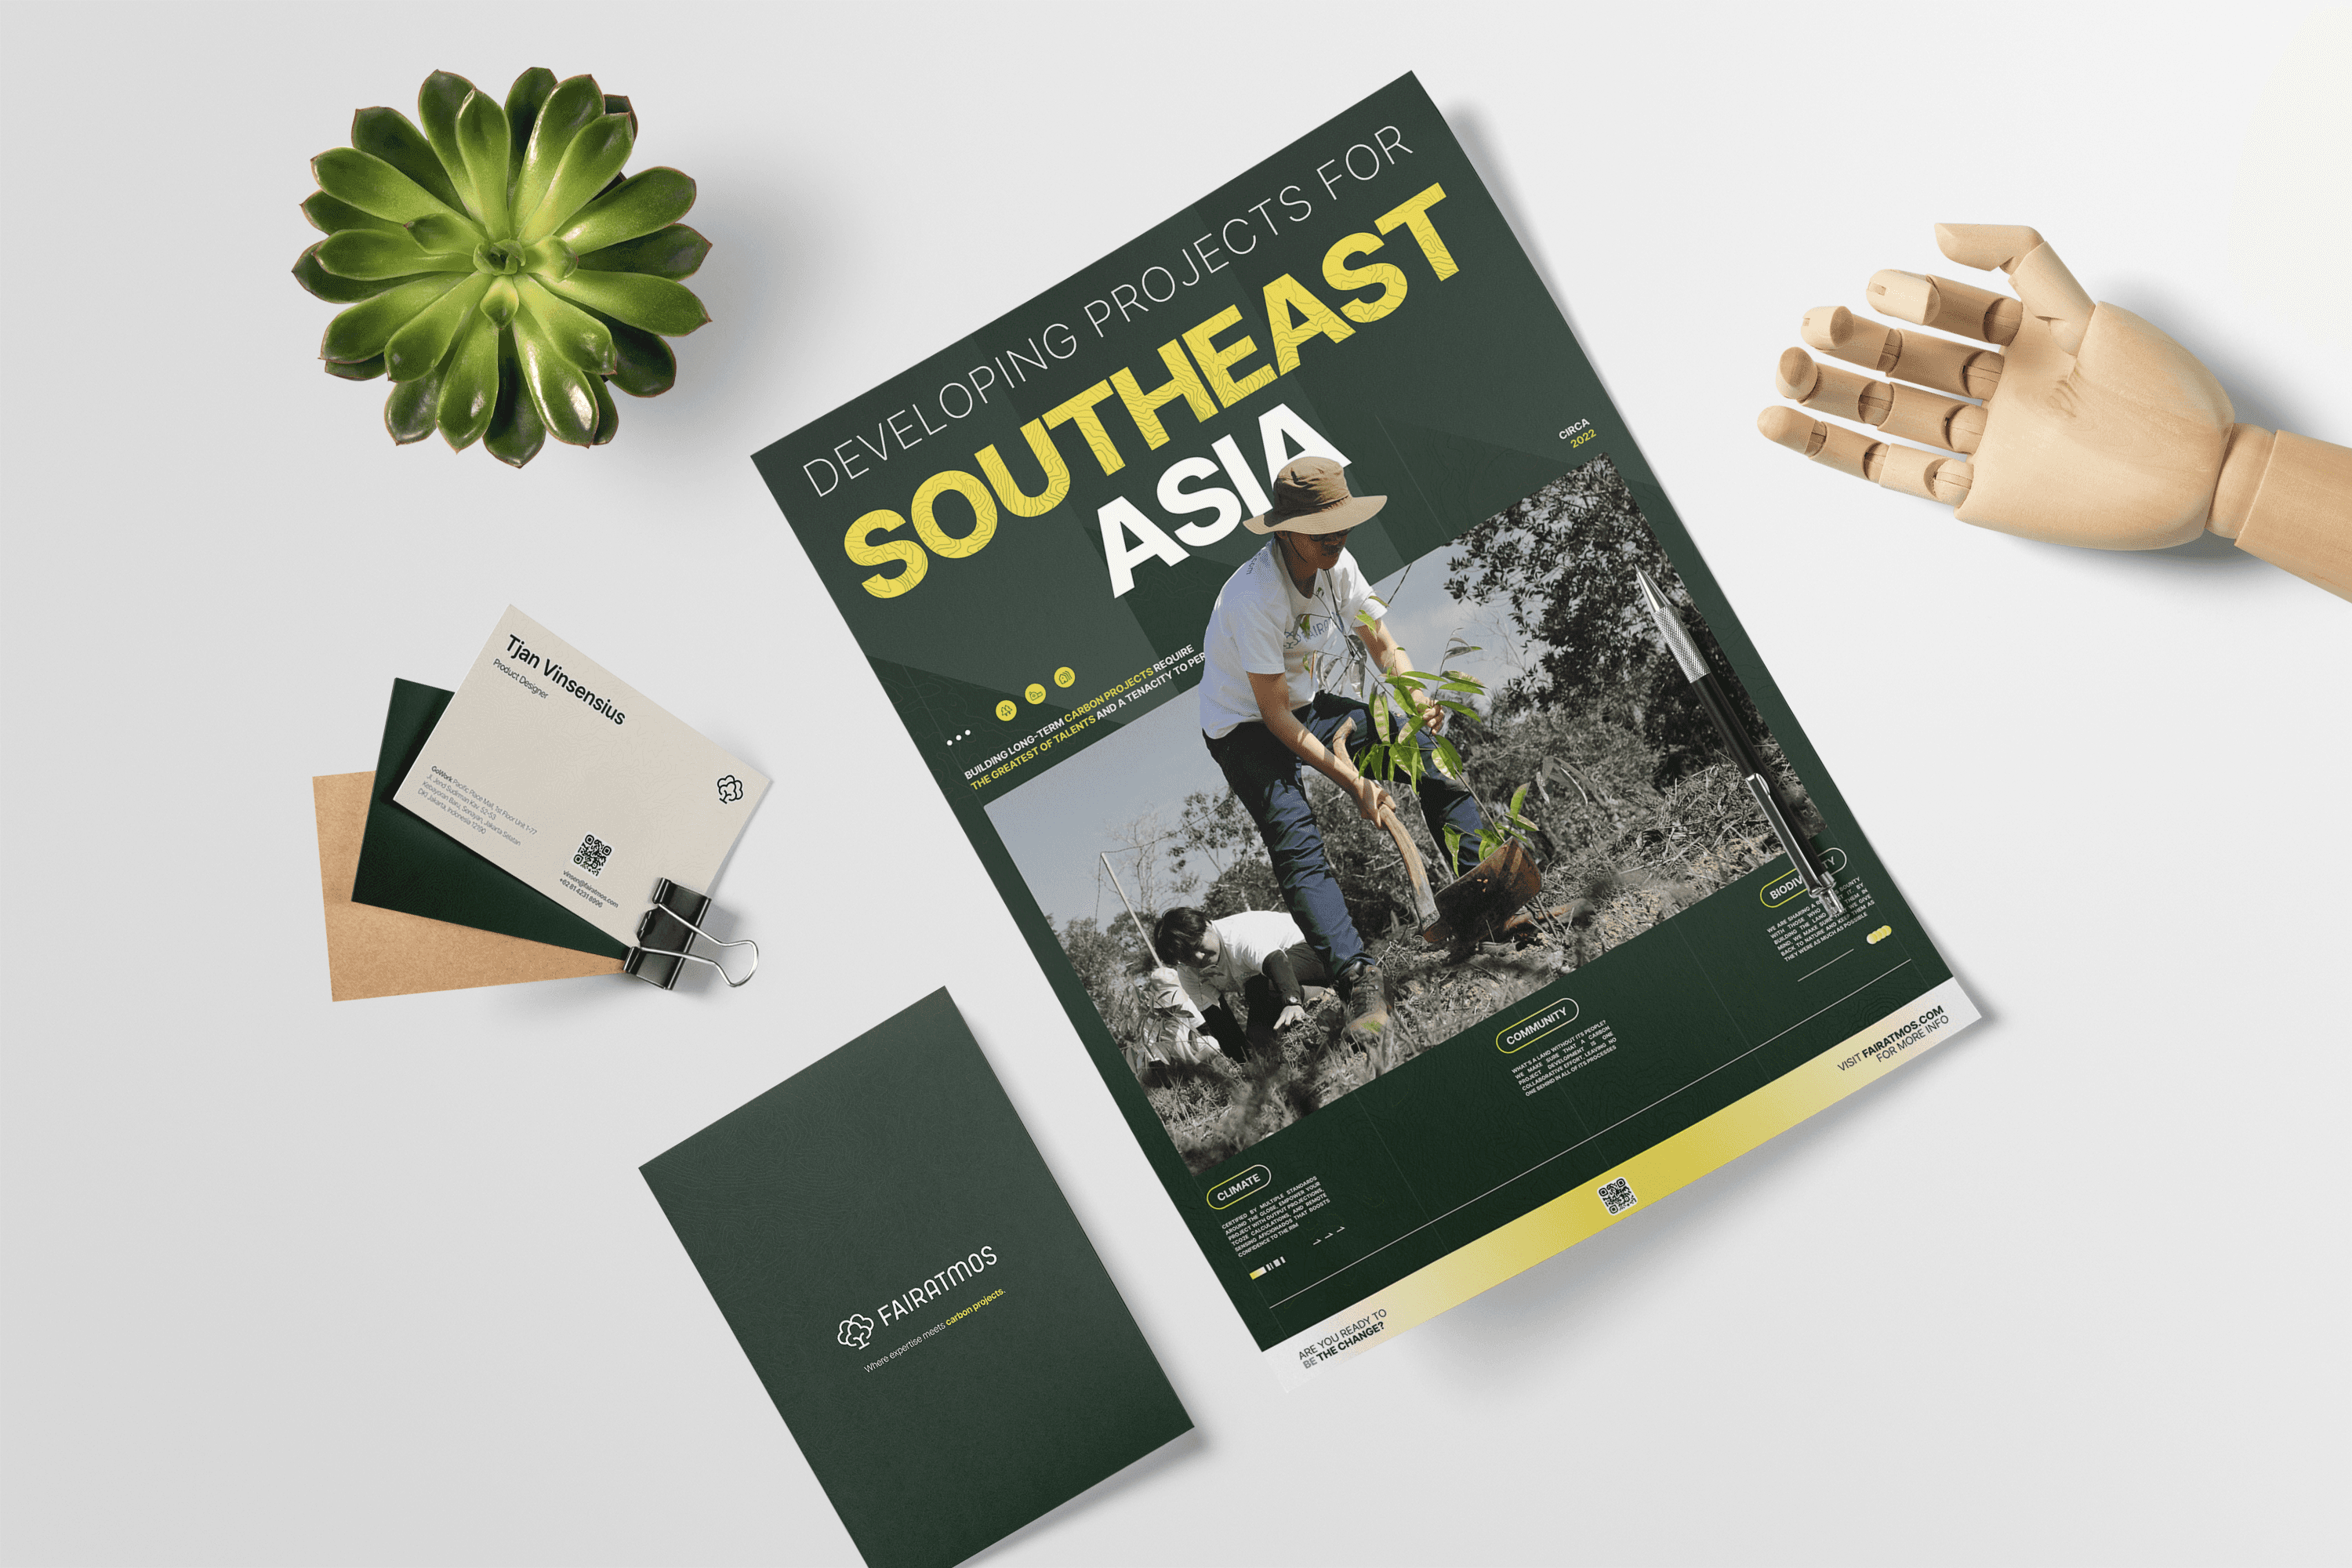
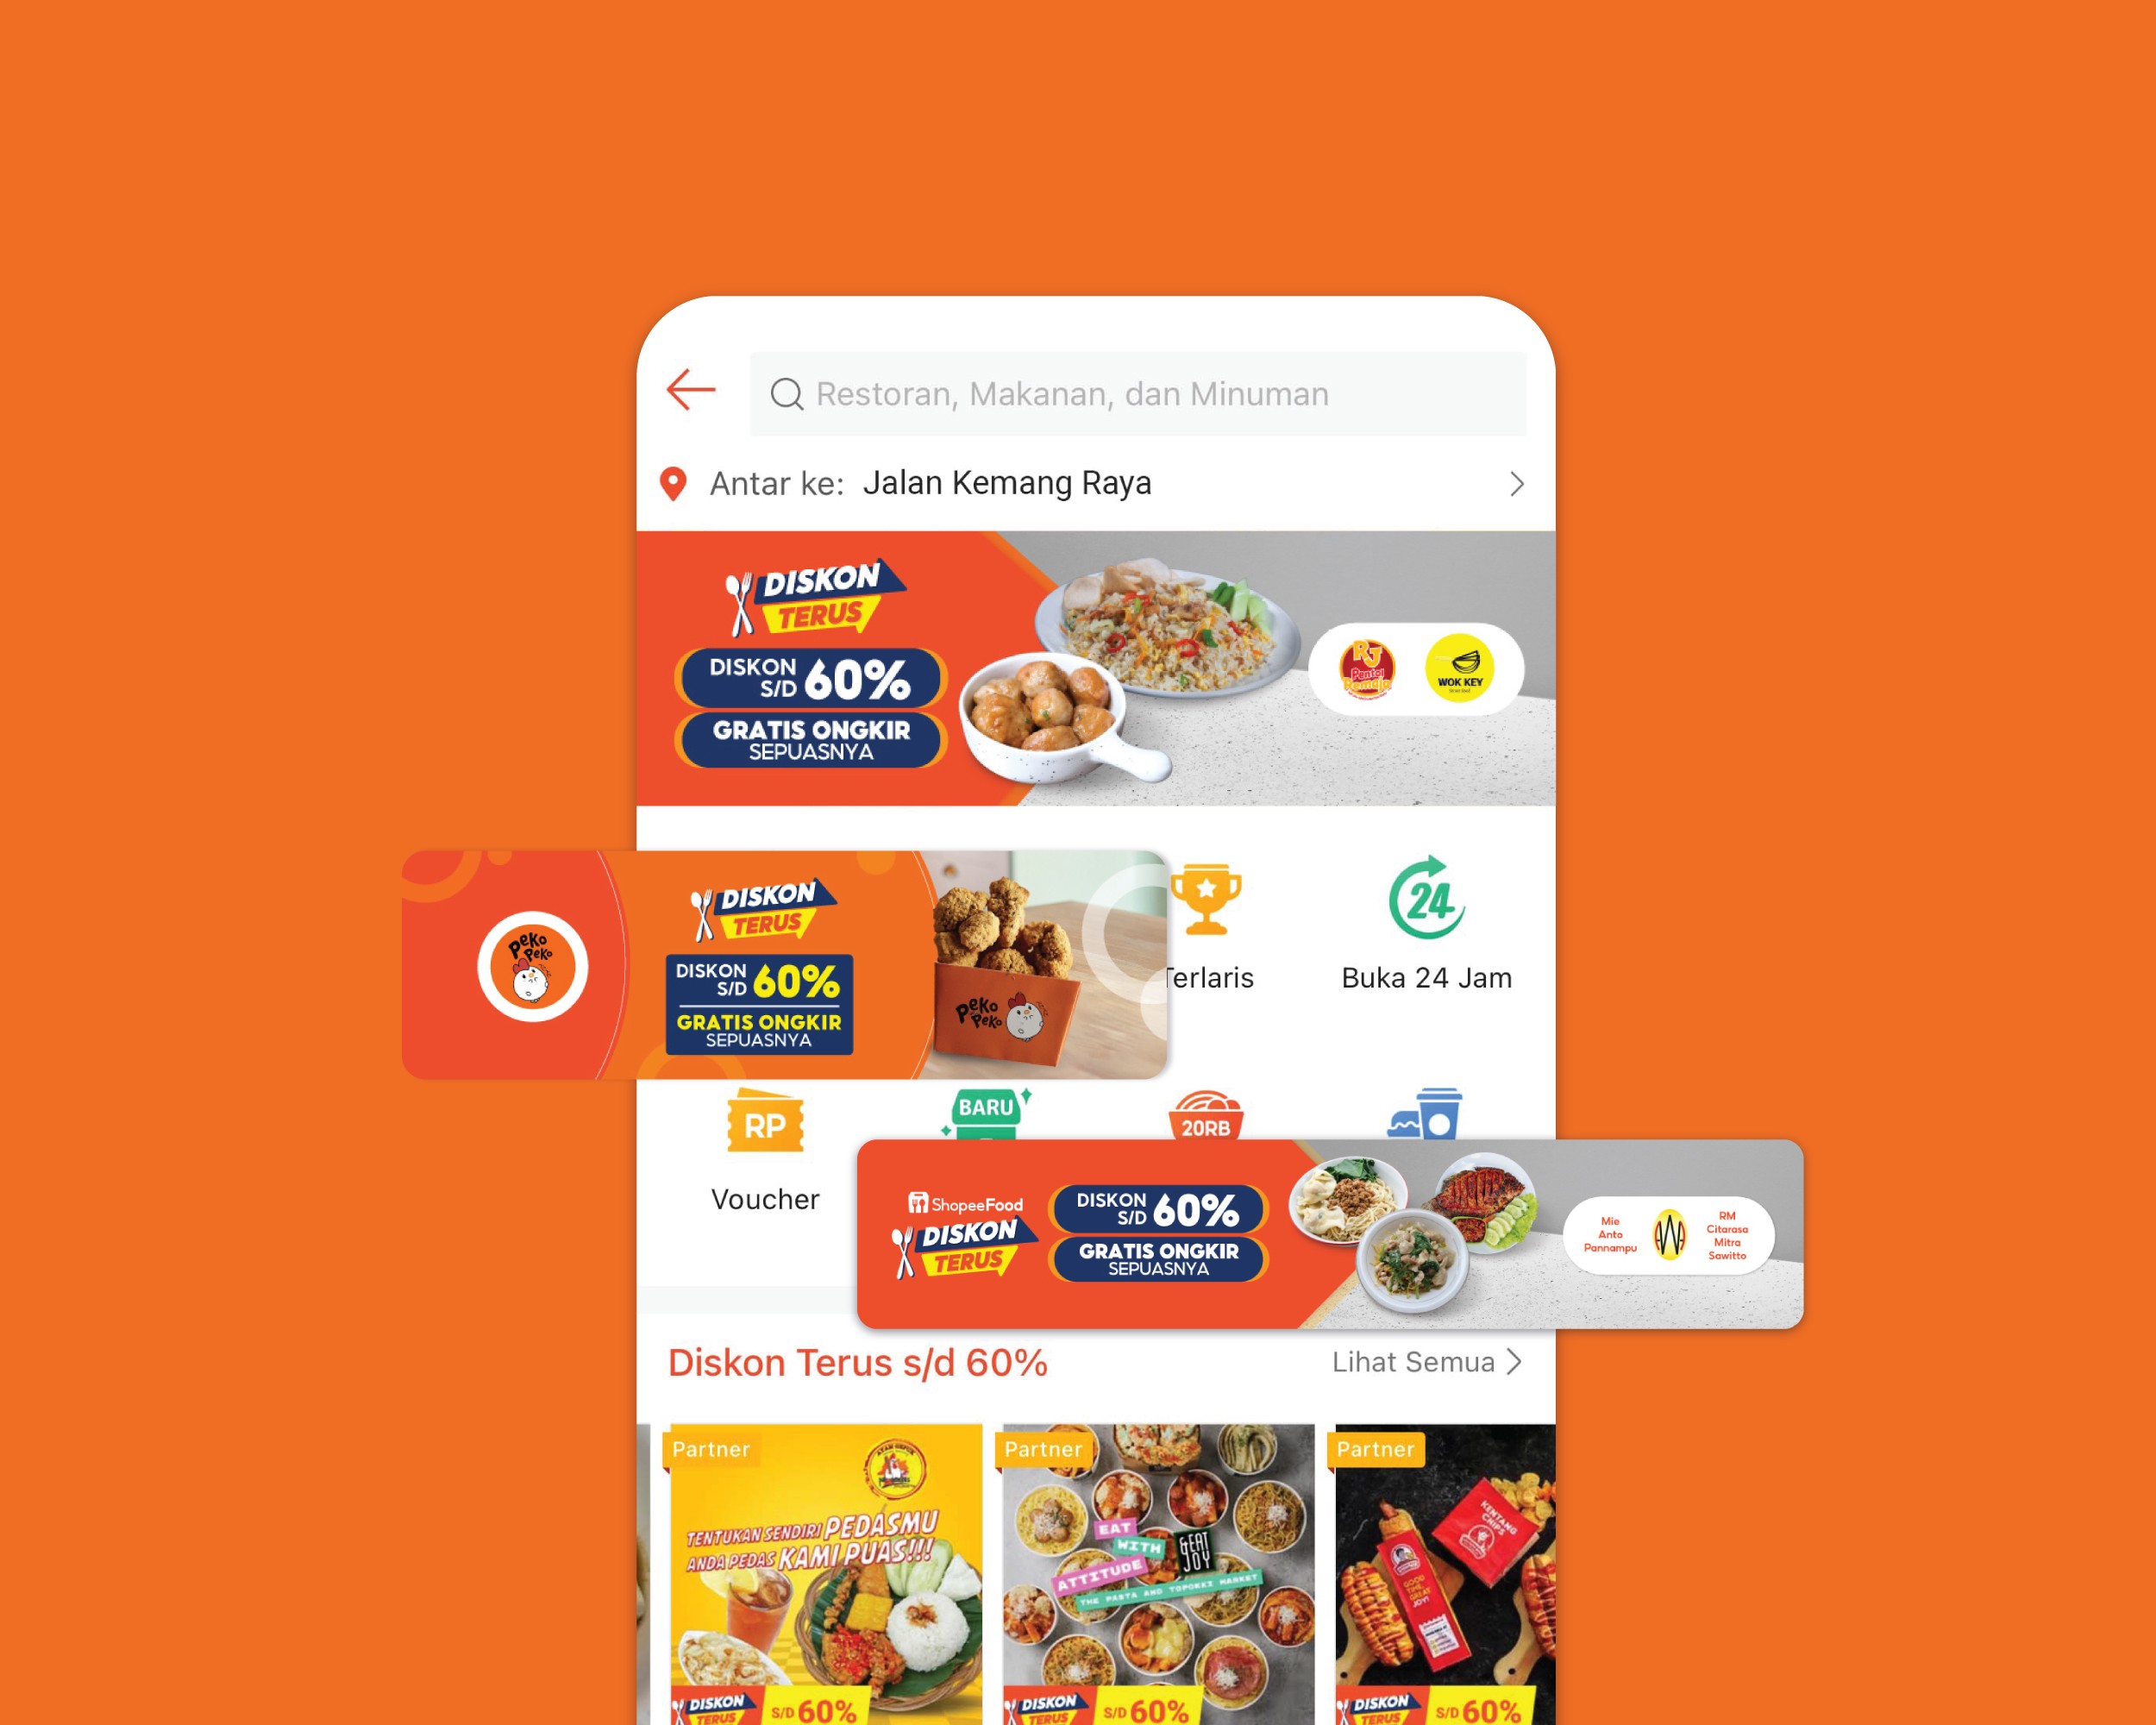
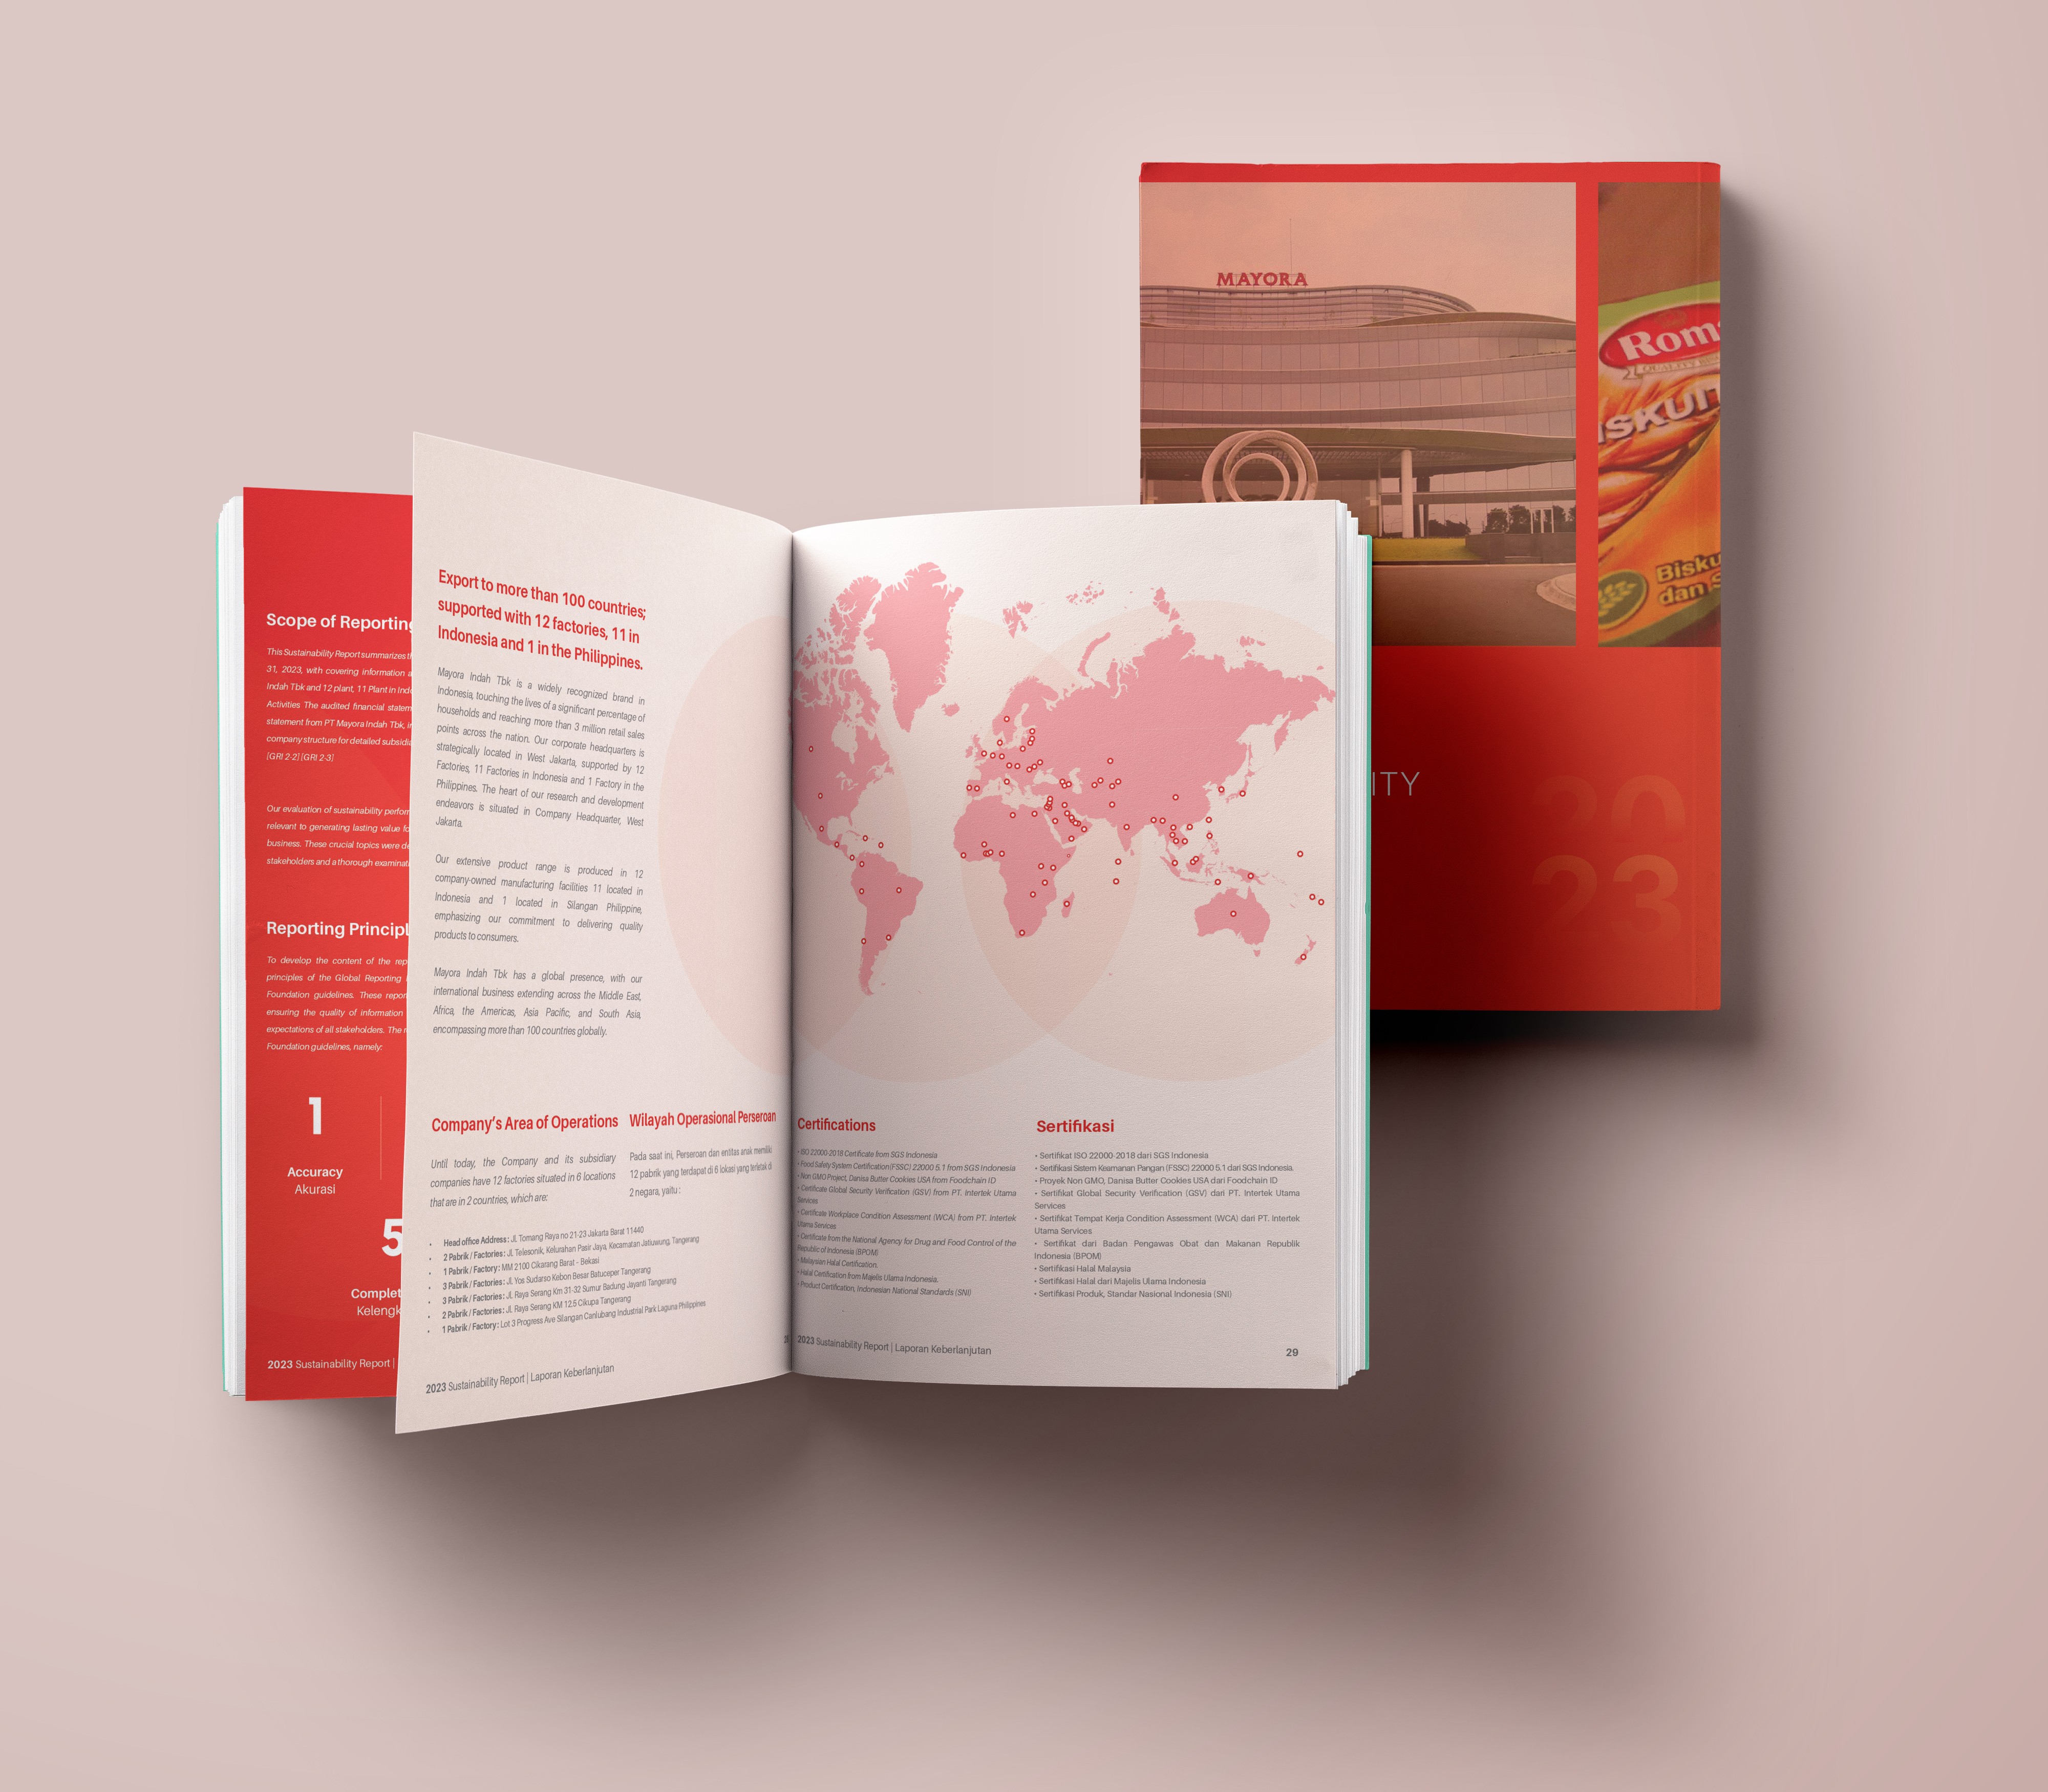
The meat of it comes from deep data visualization, since Mayora's sheer scale provides with a lot of numbers to play around visually. I chose simple (but engaging and easily understood) forms of it, from bar charts and tables to display progressive numbers to maps that display their global footprint.
Building the Story
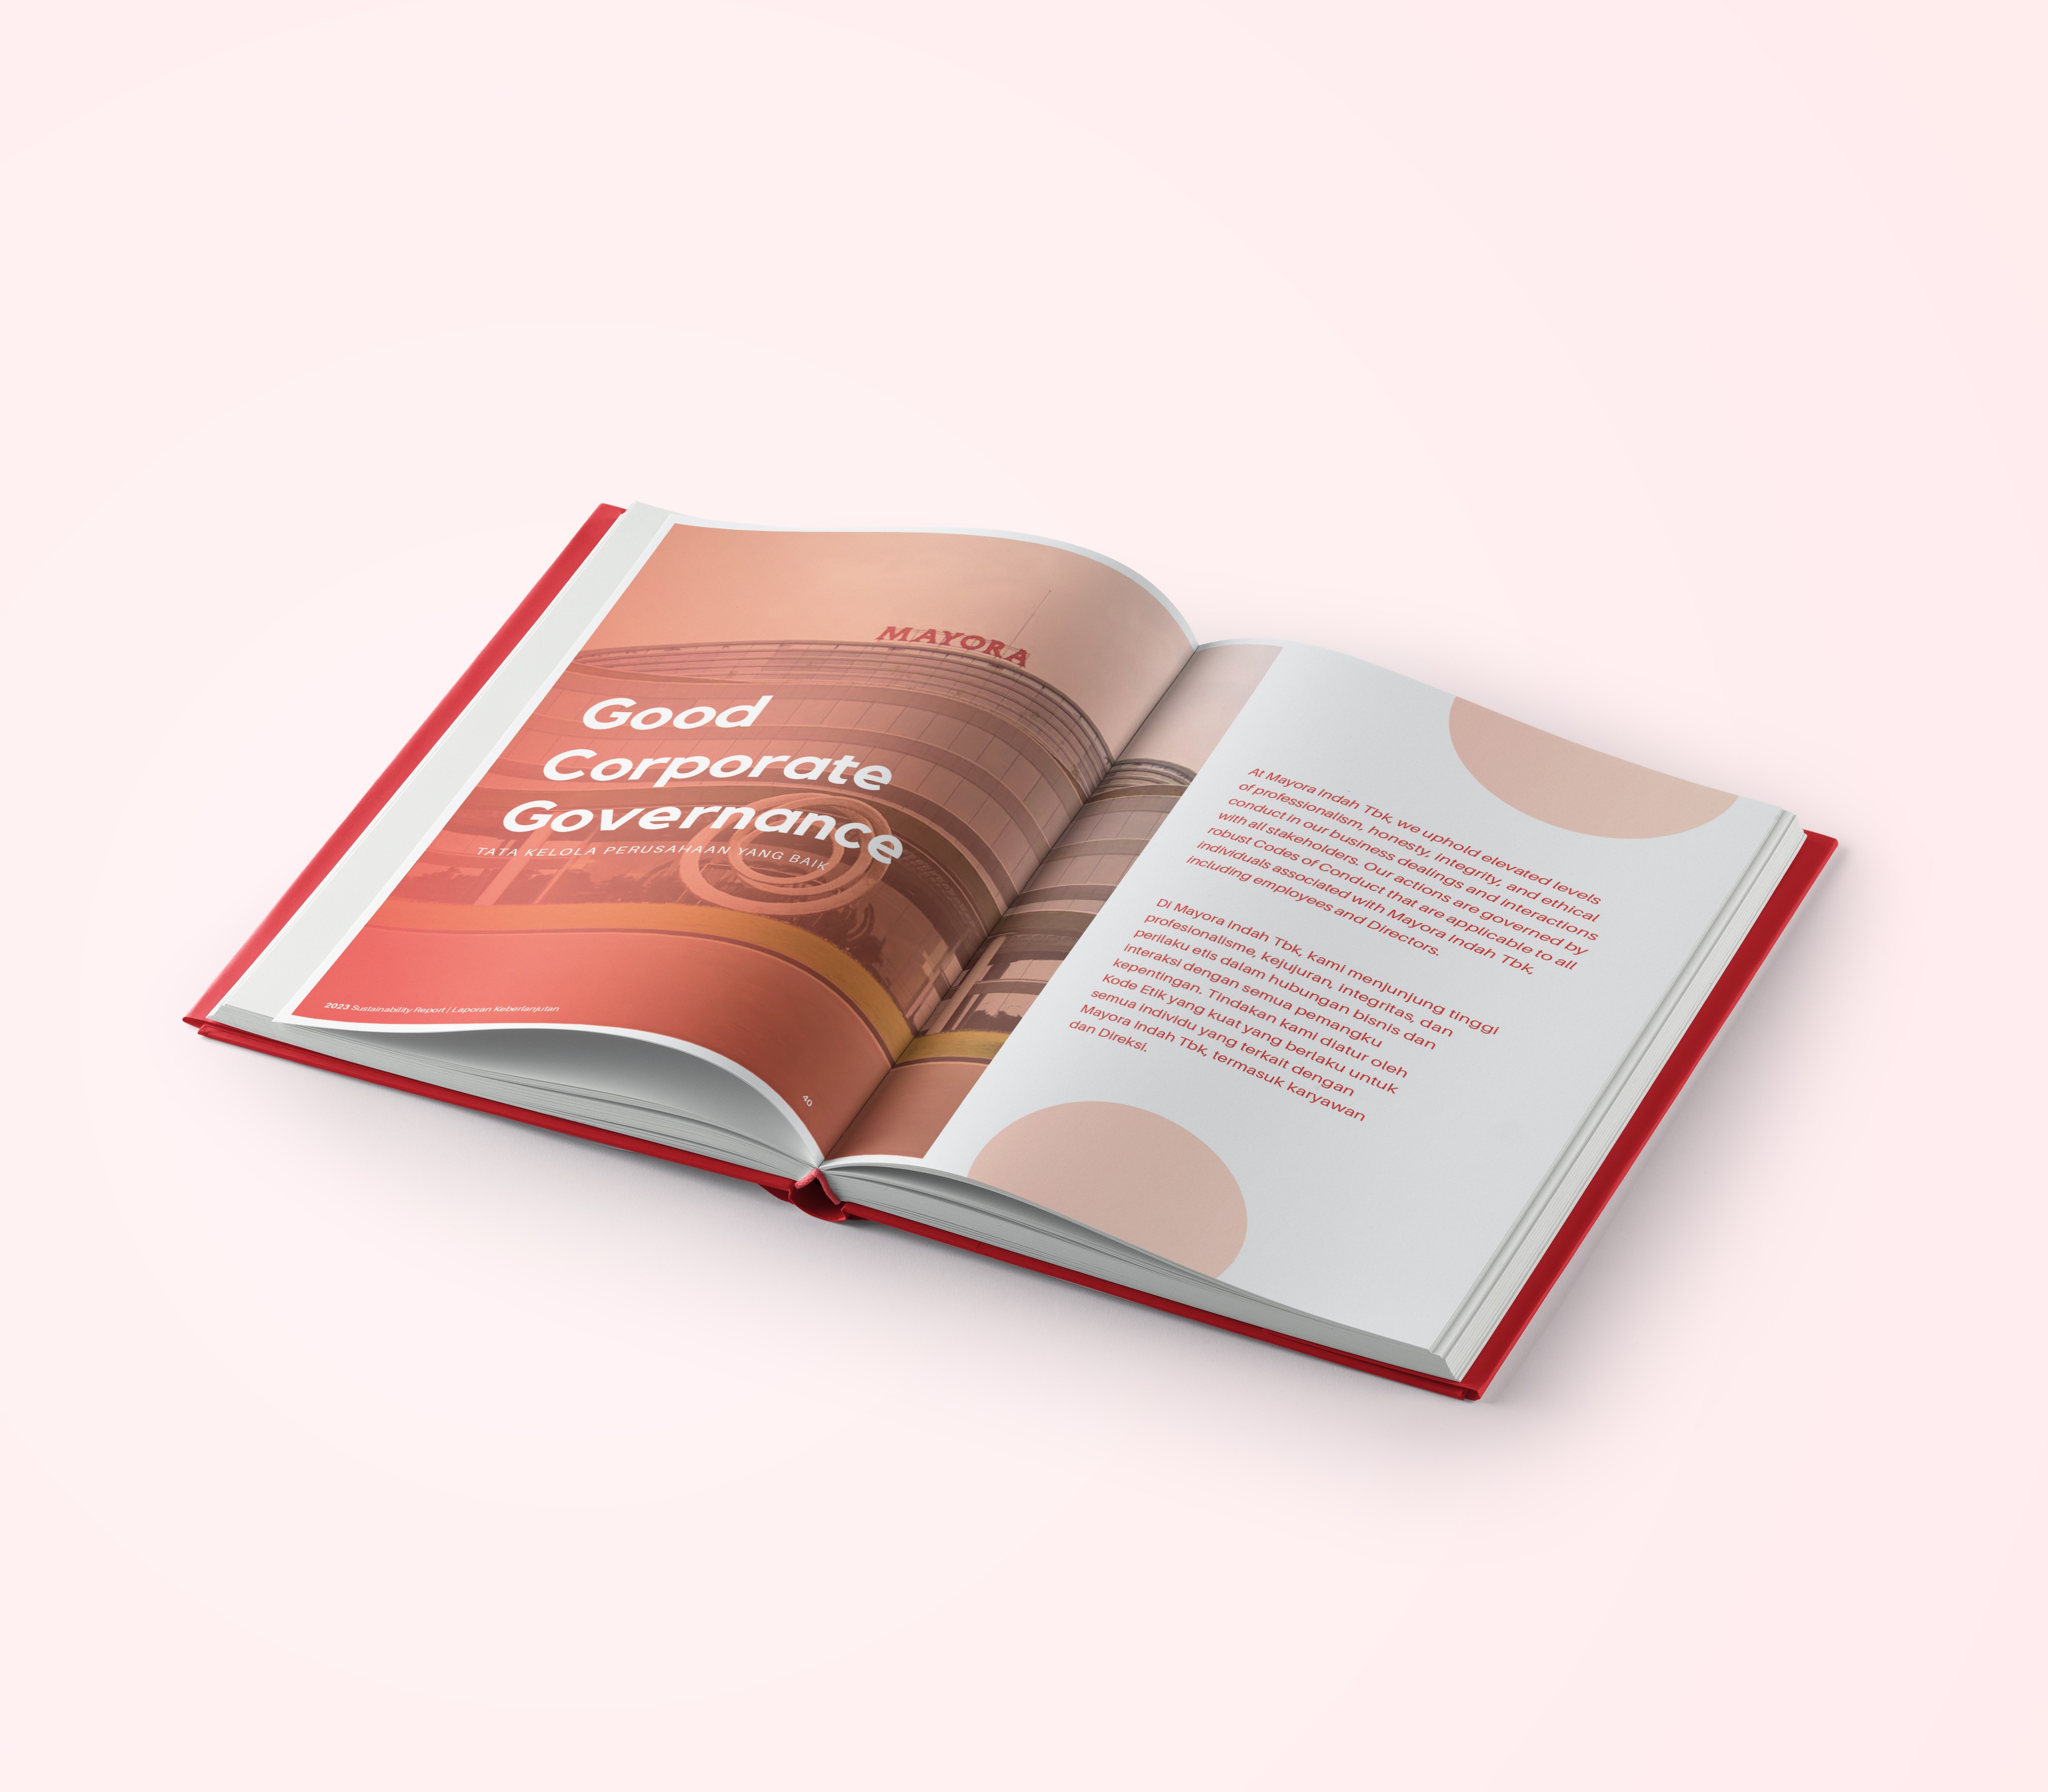
Since the company has so many interesting storylines, it would be a waste not to use it in helping the users get a view of how the company tackles corporate and environmental responsibilities.
This results in the usage of many real-life documentations of their work within the report that each tell a narrative that you can deliver not only via data. So instead of merely using charts, we could tell readers "Hey, did you know that our Cikupa factory managed to trade in fossil electricity for solar power, saving 10,000 certificates’ worth of emissions?"
Finally, it was all about print‑readiness and polish. I laid out a two‑language format (English/Bahasa) with careful attention to margins, font sizes, and image resolution. This is combined with an entirely original design style derived from Mayora's own brand identity and values to top it all off. The end report is a document that’s as reliable as it is readable, showcasing Mayora’s real‑world impact to the world to see.